Article
Check out our subscription offers.
New subscribers receive over 130 articles in the 22 issues published each year, plus the last five years of issues (that’s over 1,200 articles) as a download link, which are fully searchable in PDF format.
Articles in this Issue
Charts, Tables and Graphs in this Issue
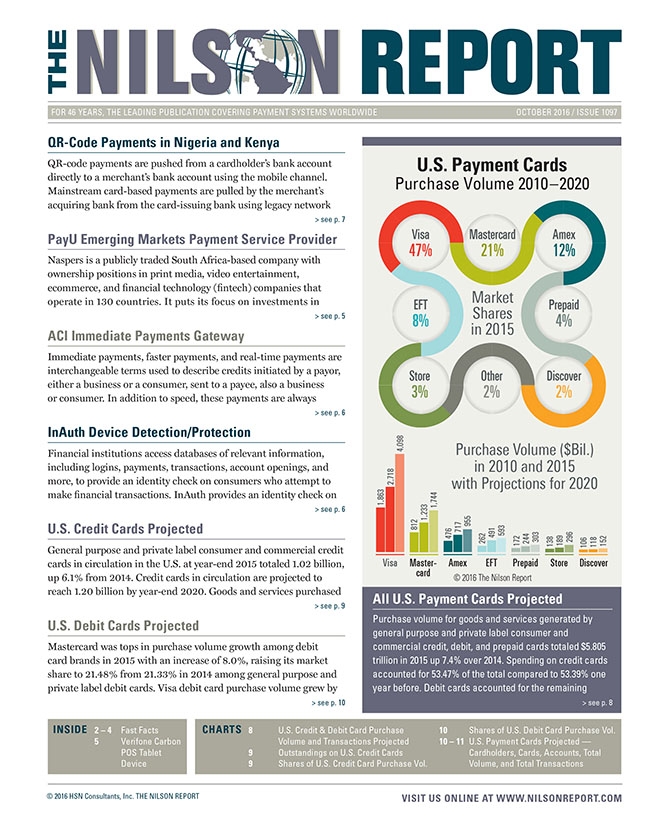
U.S. Payment Cards Purchase Volume 2010 – 2020
U.S. Credit and Debit Purchase Volume
U.S. Credit and Debit Purchase Transactions
U.S. Credit Card Purchase Volume Market Shares
U.S. Credit Card Outstandings
U.S. Debit Card Purchase Volume Market Shares
U.S. Credit and Debit Cardholders
U.S. Credit and Debit Cards
U.S. Credit and Debit Card Accounts
U.S. Credit and Debit Total Volume
U.S. Credit and Debit Total Transactions
Nilson Report
Expertise
Research
News & Events
Subscribe
Connect
Mailing Address:
PO Box 50539
Santa Barbara, CA 93150
USA
Phone:
805-684-8800