Article
Check out our subscription offers.
New subscribers receive over 130 articles in the 22 issues published each year, plus the last five years of issues (that’s over 1,200 articles) as a download link, which are fully searchable in PDF format.
Articles in this Issue
Charts, Tables and Graphs in this Issue
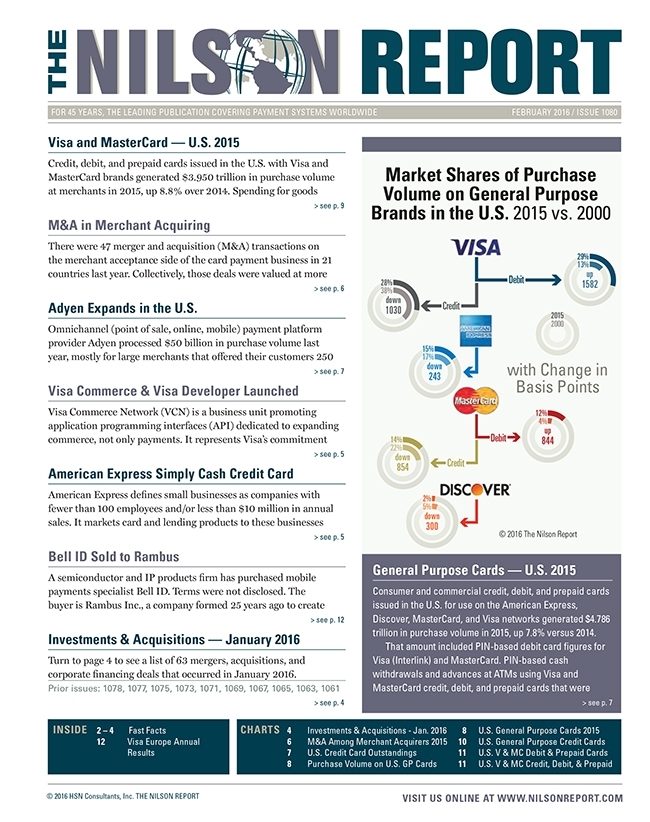
Market Shares of Purchase Volume on General Purpose Brands in the U.S.
Investments & Acquisitions January 2016
Mergers & Acquisitions Among Merchant Acquirers 2015
U.S. Credit Card Outstandings
Purchase Volume on U.S. General Purpose Cards 2015
U.S. General Purpose Cards 2015 vs. 2014
Change in Purchase Volume 2015 vs. 2014
Visa vs. MasterCard Purchase Volume
U.S. General Purpose Credit Cards
U.S. Visa and MasterCard Debit & Prepaid Cards
U.S. Visa and MasterCard Credit, Debit, & Prepaid