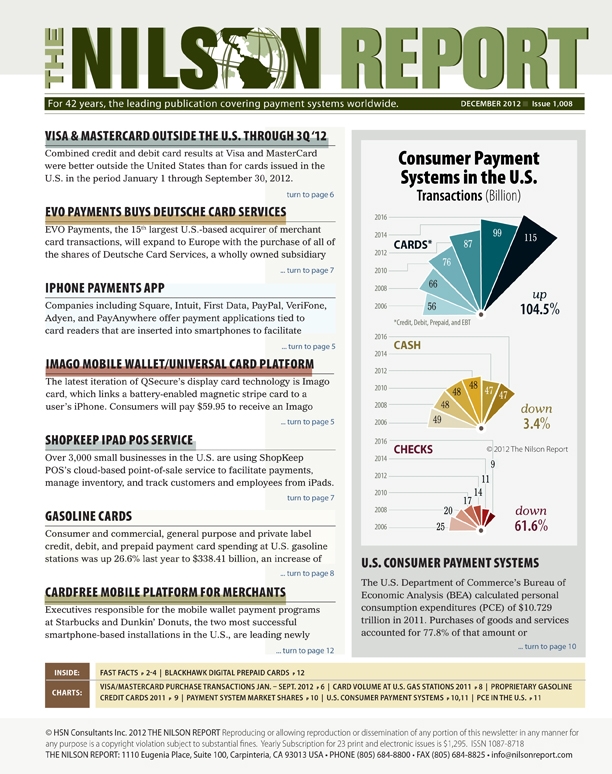
Consumer Payment Systems in the U.S., Transactions, 2006 through 2016, Cards, Cash, Checks
Visa & MasterCard Purchase Transactions (Credit, Debit), January-September 2012, Inside the U.S. vs. Outside the U.S.
Card Volume at U.S. Gas Stations 2011: Total, Visa & MasterCard, Proprietary, American Express, Discover Card, 3rd Party Fleet, PIN Debit
Oil Company Proprietary Credit Cards 2011 (Personal & Business, Fleet): Volume, Transactions, Accounts, Active Accounts, Cards
U.S. Consumer Payment Systems, 2006, 2011, 2016, Paper (Checks, Cash, Money Orders, Official Checks, Travelers Cheques), Cards (Credit Cards, Debit Cards, Prepaid Cards, EBT Cards), Electronic (Preauthorized Payments, Remote Payments)
Personal Consumption Expenditures, 2006 vs. 2016, Purchases, Nonpurchases