Award-winning business intelligence, payment card statistics, industry news, and dozens of executive contacts in every issue. Subscribers receive 22 issues a year.
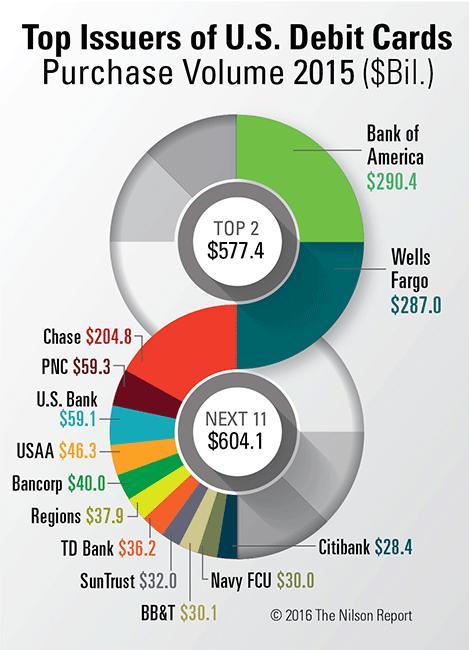
The 13 largest U.S. issuers of debit and prepaid cards are ranked based on purchase volume at merchants.
Featured Companies
The following companies are featured in this issue of the Nilson Report. News about companies appears in feature articles, as well as in the First Look and Management Changes sections of the newsletter. To submit general information about your company, or to share news with us, please contact us.
Top Issuers of U.S. Debit Cards – Purchase Volume 2015
Investments & Acquisitions – March 2016
Star-Branded Cards
Market Shares of Purchase Volume for Top U.S. Debit Card Issuers 2015
Debit Products Market Shares for Top 50 U.S. Issuers
Debit Card Transaction Growth Among Top U.S. Issuers 2015 vs. 2014
Top 50 Debit Card Issuers in the U.S. 2015 – Ranked by Purchase Volume
FEATURED STATISTICS
Debit Products Market Shares for Top 50 Issuers
The top 50 U.S. general purpose-type debit card issuers in 2015 accounted for $1.521 trillion in purchase volume, separated into signature-based, PIN-based, and prepaid.