Award-winning business intelligence, payment card statistics, industry news, and dozens of executive contacts in every issue. Subscribers receive 22 issues a year.
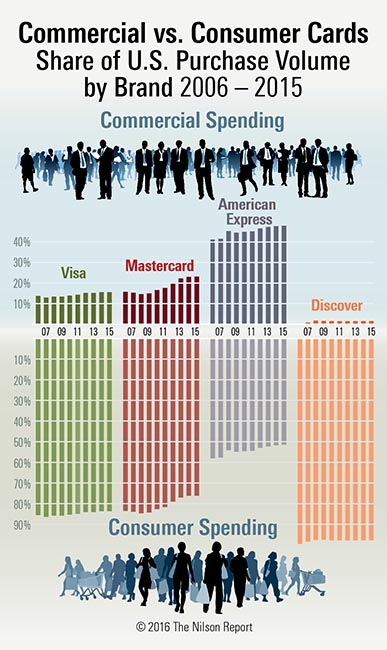
Commercial vs. Consumer Cards Share of U.S. Purchase Volume
Cards issued in the U.S. generated $4.786 trillion in purchase volume in 2015. The chart shows spending by commercial vs. consumer products by card brand.
Featured Companies
The following companies are featured in this issue of the Nilson Report. News about companies appears in feature articles, as well as in the First Look and Management Changes sections of the newsletter. To submit general information about your company, or to share news with us, please contact us.
Commercial vs. Consumer Cards Share of U.S. Purchase Volume by Brand
Purchase Volume on U.S. Cards in 2015
Top U.S. General Purpose Credit Card Issuers Midyear 2016
U.S. Visa/Mastercard Credit Card Issuers – Outstandings Midyear 2016
U.S. Visa/Mastercard Credit Card Issuers – Volume Midyear 2016
Total Chip Card Shipments Worldwide – 2015
Shipments by Category and Type of Card Worldwide – 2015
FEATURED STATISTICS
Total Chip Card Shipments Worldwide – 2015
The 50 largest manufacturers of chip cards worldwide are listed in the chart on page 10. The five largest are shown here ranked by cards shipped in 2015.
Gemalto, Netherlands
2,664.6 million cards shipped Oberthur Technologies, France
1,189.5 million cards shipped Giesecke & Devrient, Germany
997.1 million cards shipped Safran (was Morpho), Germany
820.9 million cards shipped Watchdata System, China/Singapore
569.2 million cards shipped
Full access to the Total Chip Card Shipments Worldwide – 2015 results is available when you subscribe to The Nilson Report.
Free Sample Issue
Act Now – Receive a free issue of the Nilson Report