Award-winning business intelligence, payment card statistics, industry news, and dozens of executive contacts in every issue. Subscribers receive 22 issues a year.
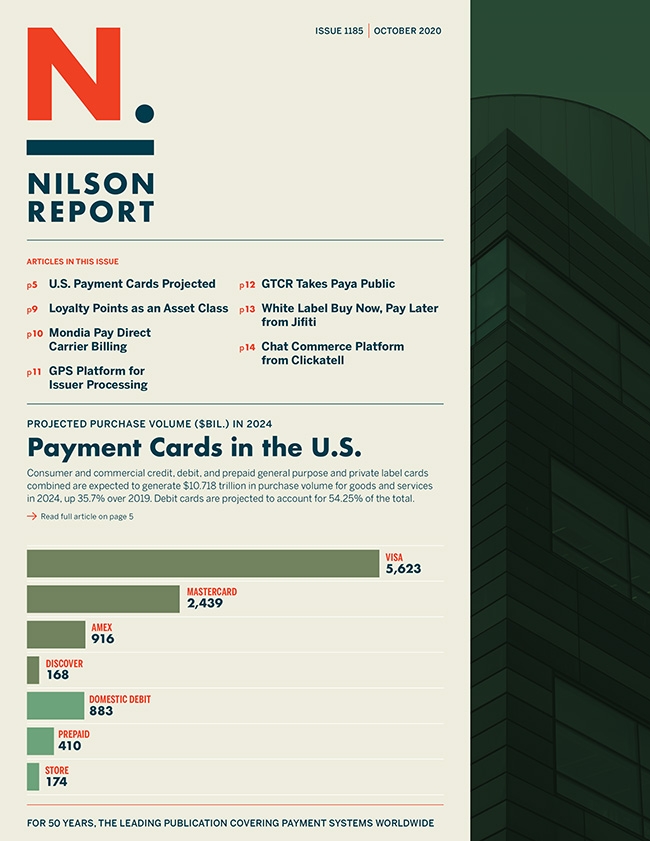
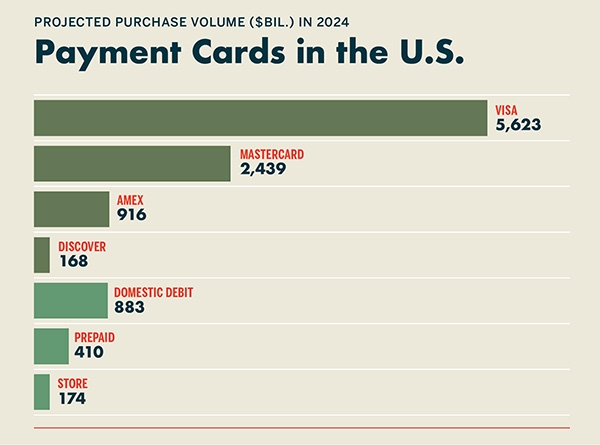
Payment Cards in the U.S. Projected Purchase Volume in 2024
Consumer and commercial credit, debit, and prepaid general purpose and private label cards combined are expected to generate $10.718 trillion in purchase volume for goods and services in 2024, up 35.7% over 2019.
Featured Companies
The following companies are featured in this issue of the Nilson Report. News about companies appears in feature articles, as well as in the First Look and Management Changes sections of the newsletter. To submit general information about your company, or to share news with us, please contact us.
Our publication connects subscribers in over 80 countries to information and
statistics not available from any other source. We have a subscription renewal
rate that would be the envy of any publication, in any field. On page 15, we ask you to consider referring the Nilson Report to a colleague. Please do give that some thought. They will be glad you did.
Payment Cards in the U.S. Projected Purchase Volume in 2024
U.S. Payment Cards—Purchase Volume
U.S. Payment Cards—Purchase Transactions
U.S. Payment Cards—Purchase Volume 2019 vs. 2024
U.S. Payment Cards—Total Volume
U.S. Payment Cards—Total Transactions
U.S. Payment Cards—Outstandings
U.S. Payment Cards—Cardholders
U.S. Payment Cards—Cards
FEATURED STATISTICS
U.S. Payment Cards—Purchase Transactions
Consumer and commercial general purpose and private label credit, debit, and prepaid cards are featured in this issue. Purchase transactions are listed for all brands and products. The totals are shown here.
Credit Card Totals
52.23 Billion projected in 2024 Debit Card Totals
116.93 Billion projected in 2024 Credit and Debit Totals
169.16 Billion projected in 2024
Full access to the Payment Cards—Purchase Transactions results in the United States is available when you subscribe to the Nilson Report.
Free Sample Issue
See What Payments Industry Leaders Read
Receive a Complimentary Issue of the Nilson Report
Our Free Trial Offer Just Got an Upgrade Start Two Months of Full Access to the Nilson Report
Free trial access now includes all subscriber benefits, including complete data tables on issuers and acquirers worldwide and our exclusive subscriber portal. No Restrictions. No payment card required.
See why executives in 80+ countries rely on the Nilson Report for best-in-class data and business intelligence.