

The following companies are featured in this issue of the Nilson Report. News about companies appears in feature articles, as well as in the First Look and Management Changes sections of the newsletter. To submit general information about your company, or to share news with us, please contact us.


In this issue we introduce a ranking of publicly traded companies in the
payment industry. This ranking will become a regular feature, and we expect
the number of listed companies to increase steadily as investors worldwide
see opportunities for profit in a growing number of innovative payment-related
businesses.

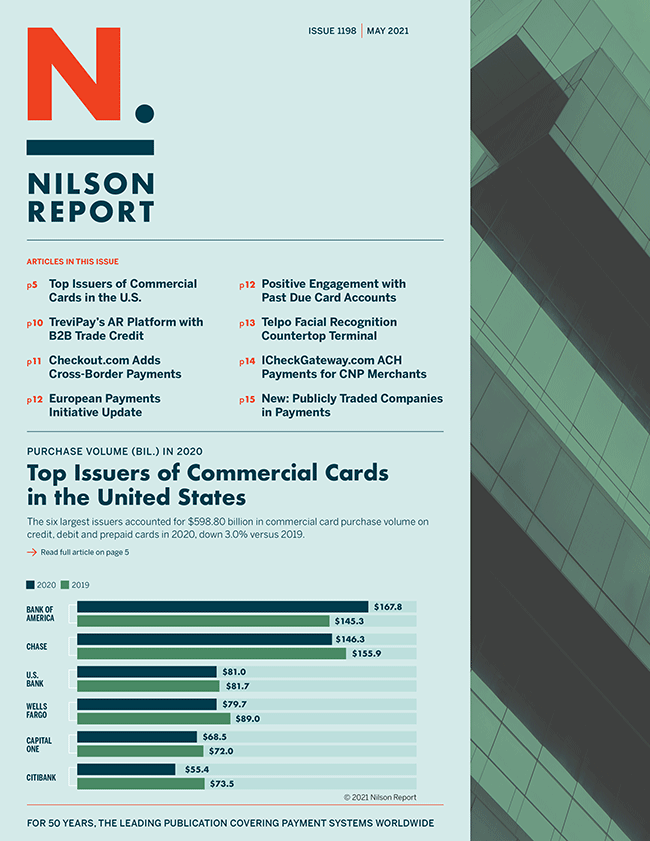
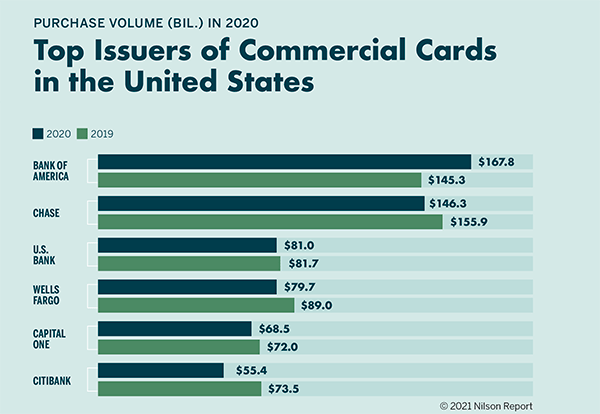
Top Issuers of Commercial Cards in the U.S.
Purchase Volume on U.S. Commercial Cards by Type with Market Share and Change in Purchase Volume
U.S. Visa & Mastercard Commercial Card Issuers Ranked by Purchase Volume in 2020
U.S. Corporate Cards
Purchase Volume on Corporate, Purchasing and Fleet Cards in the U.S.—2016 through 2020
U.S. Purchasing and Fleet Cards
Commercial Prepaid Cards in the U.S.
U.S. Business Credit Cards
U.S. Business Debit Cards
Publicly Traded Companies in Payments
Purchase volume on commercial cards issued in the United States totaled $942.2 billion in 2020 with purchasing/fleet and corporate cards accounting for a combined 34%, followed by business credit with 31%.
Purchasing/Fleet/Corporate
$321.6 billion
Small Business Credit
$286.2 billion
Small Business Debit
$173.0 billion
Prepaid
$161.3 billion
Full access to the Purchase Volume on U.S. Commercial Cards by Type results including market share and change in purchase volume is available when you subscribe to the Nilson Report.
Nilson Report
Expertise
Research
News & Events
Subscribe
Connect
Mailing Address:
PO Box 50539
Santa Barbara, CA 93150
USA
Phone:
805-684-8800
