Menu

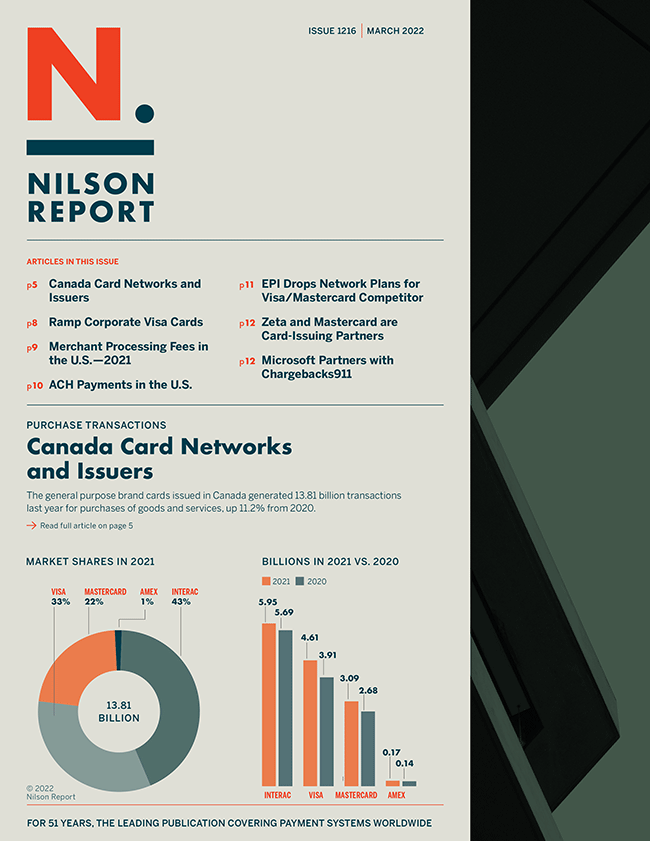
The following companies are featured in this issue of the Nilson Report. News about companies appears in feature articles, as well as in the First Look and Management Changes sections of the newsletter. To submit general information about your company, or to share news with us, please contact us.














We are regularly asked how much it costs to be featured in the Nilson Report. Our standard reply is… “Nothing.” We simply do not accept payment for ads of any kind at our website or in these pages. In 51 years of business, we have never published articles that other publications refer to as advertorials or sponsored content. Our revenue comes exclusively from subscribers. We prefer it that way. It makes it easier for us to select unbiased content for professionals who pay us an annual fee to receive the highest quality market intelligence. You can trust that we will never change our policy.

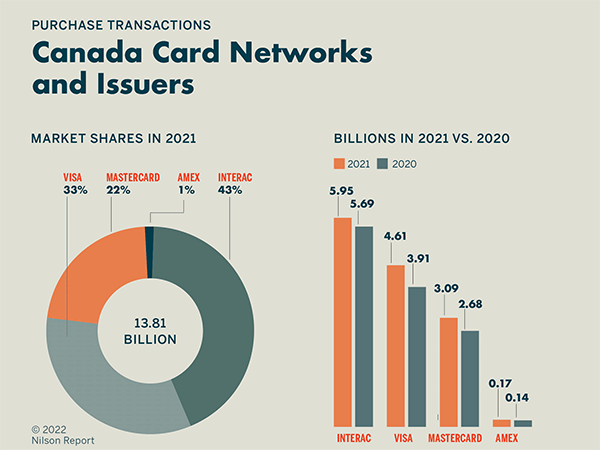
Canada Card Networks and Issuers—Purchase Transactions
Canada Market Shares of Visa and Mastercard Outstandings at Year-End 2021
Canada Spending, Transactions and Card by Brand
Largest Credit Card Issuers in Canada—Ranked by Outstandings
Merchant Processing Fees in the U.S as a Percent of Card Sales
Fees Paid by Merchants in the U.S. with Purchase Volume
U.S. Consumer ACH Transactions—2021
Publicly Traded Companies in Payments
Last year, consumers initiated 14.89 billion direct ACH transactions valued at $9.093 trillion. The largest four categories, ranked by number of transactions, are listed below.
1. Internet, 8,715.5 million transactions
Value: $4,578.30 billion
2. Recurring Bills, 4,431.6 million transactions
Value: $3,919.30 billion
3. Lockbox, 690.8 million transactions
Value: $251.40 billion
4. Telephone, 673.6 million transactions
Value: $306.50 billion
Full access to the Consumer ACH Payments in the U.S. table is available when you subscribe to the Nilson Report.
Nilson Report
Expertise
Research
News & Events
Subscribe
Connect
Mailing Address:
PO Box 50539
Santa Barbara, CA 93150
USA
Phone:
805-684-8800
