Article
Check out our subscription offers.
New subscribers receive over 130 articles in the 22 issues published each year, plus the last five years of issues (that’s over 1,200 articles) as a download link, which are fully searchable in PDF format.

Articles in this Issue
Charts, Tables and Graphs in this Issue
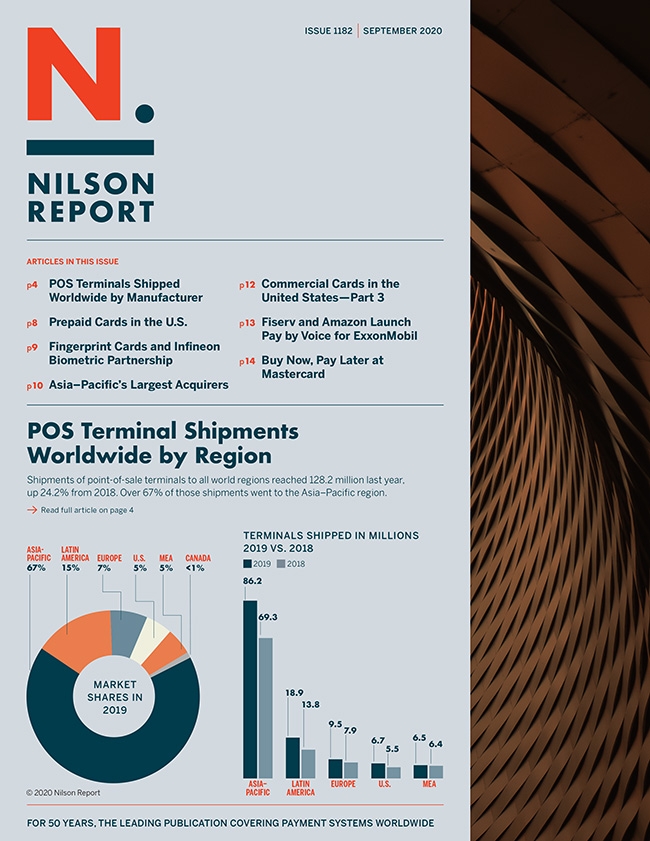
POS Terminal Shipments Worldwide by Region–Market Shares
POS Terminal Shipments by Type of Device
mPOS Devices Shipped in 2019
Manufacturers of POS Terminals Shipped in 2019–with Totals and mPOS Devices
Top 25 U.S. Issuers of Prepaid Cards
Top Acquirers of General Purpose Cards in Asia-Pacific
Top Acquirers of Visa and Mastercard Transactions in Asia-Pacific
Asia-Pacific’s 34 Largest Merchant Acquirers–Ranked by Visa and Mastercard Transactions
U.S. Commercial Cards’ Increasing Share of Purchase Volume
Investments & Acquisitions–August 2020