Award-winning business intelligence, payment card statistics, industry news, and dozens of executive contacts in every issue. Subscribers receive 22 issues a year.
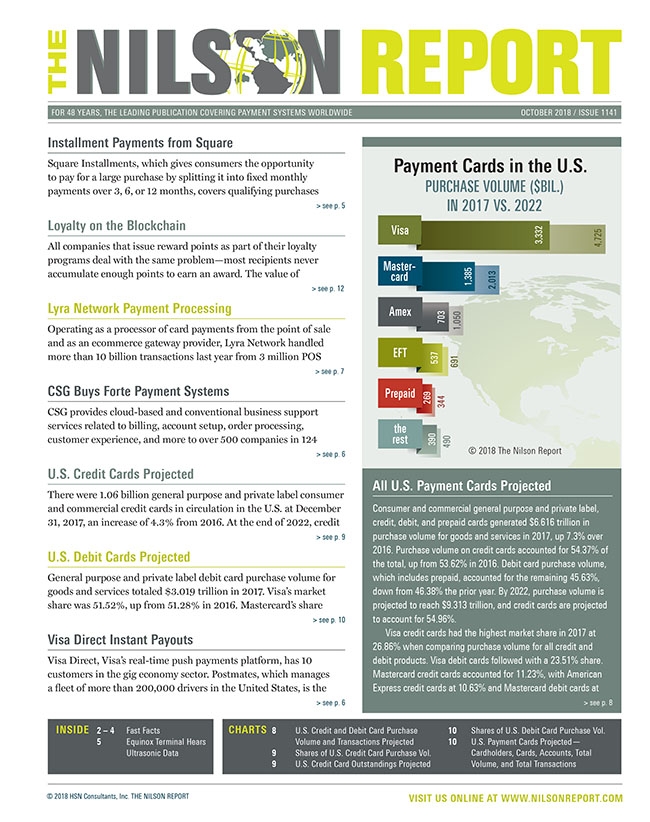
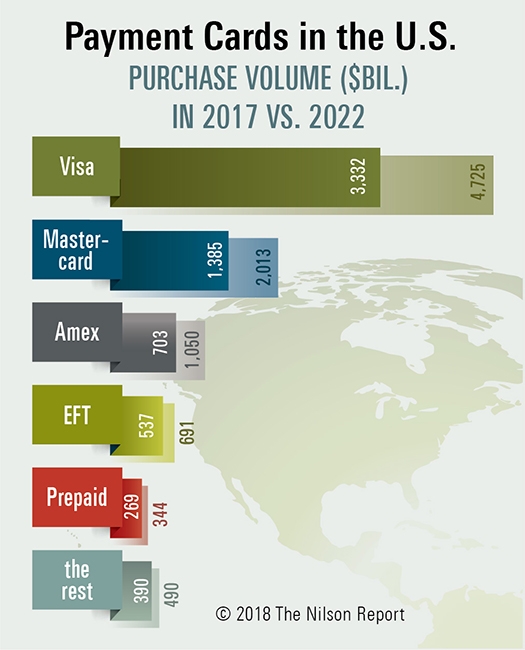
Credit, debit, and prepaid cards issued in the U.S. generated $6.616 trillion in pur-chase volume in 2017. That figure will rise to $9.313 trillion by 2022.
Featured Companies
The following companies are featured in this issue of the Nilson Report. News about companies appears in feature articles, as well as in the First Look and Management Changes sections of the newsletter. To submit general information about your company, or to share news with us, please contact us.
Payment Cards in the U.S.—Purchase Volume in 2017 vs. 2022
U.S. Credit and Debit Purchase Volume Projected
U.S. Credit and Debit Purchase Transactions Projected
U.S. Credit Card Purchase Volume Market Shares
U.S. Credit Card Outstandings
U.S. Debit Card Purchase Volume Market Shares
U.S. Credit and Debit Cards Cardholders Projected
U.S. Credit and Debit Cards Projected
U.S. Credit and Debit Cards Accounts Projected
U.S. Credit and Debit Cards Total Volume Projected
U.S. credit and Debit Cards Total Transactions Projected
FEATURED STATISTICS
U.S. Credit Card Outstandings
Outstanding receivables tied to credit cards issued in the U.S. reached $1.062 trillion in 2017. Outstandings tied to U.S. credit cards will grow to $1.322 trillion by 2022.
Full access to the U.S. Credit Card Outstandings table is available when you subscribe to The Nilson Report.
Our Free Trial Offer Just Got an Upgrade Start Two Months of Full Access to the Nilson Report
Free trial access now includes all subscriber benefits, including complete data tables on issuers and acquirers worldwide and our exclusive subscriber portal. No Restrictions. No payment card required.
See why executives in 80+ countries rely on the Nilson Report for best-in-class data and business intelligence.