Award-winning business intelligence, payment card statistics, industry news, and dozens of executive contacts in every issue. Subscribers receive 22 issues a year.
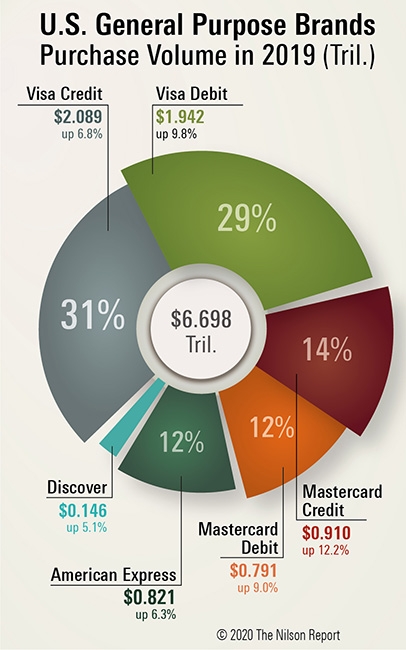
U.S. General Purpose Brands Purchase Volume in 2019
Visa, Mastercard, American Express, and Discover cards in the U.S. generated $6.698 trillion in purchase volume in 2019, up 8.5% over 2018. Growth in purchase volume is shown here.
Featured Companies
The following companies are featured in this issue of the Nilson Report. News about companies appears in feature articles, as well as in the First Look and Management Changes sections of the newsletter. To submit general information about your company, or to share news with us, please contact us.
General Purpose Cards Issued in the U.S. 2019 vs. 2018
Shares of Purchase Volume on U.S. General Purpose Cards 2019
Credit Card Outstandings—U.S. 2019 vs. 2018
General Purpose Credit Cards Issued in the U.S.
Purchase Transactions on Mastercard & Visa Credit & Debit Cards
Cards in Circulation Visa vs. Mastercard
Visa and Mastercard—U.S. Debit & Prepaid Cards
Visa and Mastercard—U.S. Credit, Debit, & Prepaid Cards
FEATURED STATISTICS
Credit Card Outstandings—U.S. 2019 vs. 2018
Credit card outstandings tied to consumer and commercial cards issued in the U.S. reached $1.018 trillion at year-end 2019, up 4.6% from the prior year.
1. Visa, $492.05 billion
+4.4% from prior year 2. Mastercard, $325.18 billion
+5.1% from prior year 3. American Express, $124.03 billion
+3.5% from prior year 4. Discover, $77.18 billion
+5.9% from prior year
Full access to the Credit Card Outstandings—U.S. 2019 vs. 2018 is available when you subscribe to The Nilson Report.
Free Sample Issue
See What Payments Industry Leaders Read
Receive a Complimentary Issue of the Nilson Report
Our Free Trial Offer Just Got an Upgrade Start Two Months of Full Access to the Nilson Report
Free trial access now includes all subscriber benefits, including complete data tables on issuers and acquirers worldwide and our exclusive subscriber portal. No Restrictions. No payment card required.
See why executives in 80+ countries rely on the Nilson Report for best-in-class data and business intelligence.