Award-winning business intelligence, payment card statistics, industry news, and dozens of executive contacts in every issue. Subscribers receive 22 issues a year.
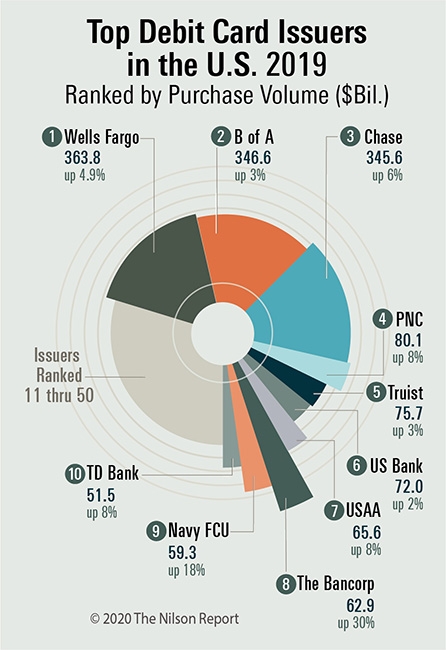
The 50 largest issuers in the U.S. ranked by purchase volume for goods and services from general purpose debit and prepaid cards issued in 2019 totaled $2.119 trillion in 2019, up 6.6% over 2018. The top 10 are shown here.
Featured Companies
The following companies are featured in this issue of the Nilson Report. News about companies appears in feature articles, as well as in the First Look and Management Changes sections of the newsletter. To submit general information about your company, or to share news with us, please contact us.
Top Debit Card Issuers in the U.S. 2019—Ranked by Purchase Volume
Debit Product Market Shares for Top 50 U.S. Issuers
Top 50 Debit Card Issuers—Ranked by Purchase Volume Per Card
Top 50 Debit Card Issuers in the U.S.—Ranked by Purchase Volume in 2019
FEATURED STATISTICS
Debit Product Market Shares for Top 50 U.S. Issuers
Spending on debit and prepaid cards issued in the U.S. for the top 50 issuers reached $2.119 trillion in 2019. That spending was divided among debit cards (signature based and PIN based) and prepaid cards. Spending and market shares figures are shown.
Our Free Trial Offer Just Got an Upgrade Start Two Months of Full Access to the Nilson Report
Free trial access now includes all subscriber benefits, including complete data tables on issuers and acquirers worldwide and our exclusive subscriber portal. No Restrictions. No payment card required.
See why executives in 80+ countries rely on the Nilson Report for best-in-class data and business intelligence.