
Listen to highlights from this issue
The following companies are featured in this issue of the Nilson Report. News about companies appears in feature articles, as well as in the First Look and Management Changes sections of the newsletter. To submit general information about your company, or to share news with us, please contact us.


Our annual research publication, The World’s Top Card Issuers and Merchant Acquirers, is available. Now in its 17th edition, the publication compiles a year of data on payment businesses worldwide and includes many businesses that don’t have the scale to make it into the top 50 rankings we publish in this newsletter. Also of interest to our readers; many of the tables in the research publication are available in downloadable Excel format, a frequently requested feature. Our Subscription Director, Lori Fulmer, would be happy to answer any questions you have about adding the research publication to your subscription. You can reach her at lfulmer@nilsonreport.com.

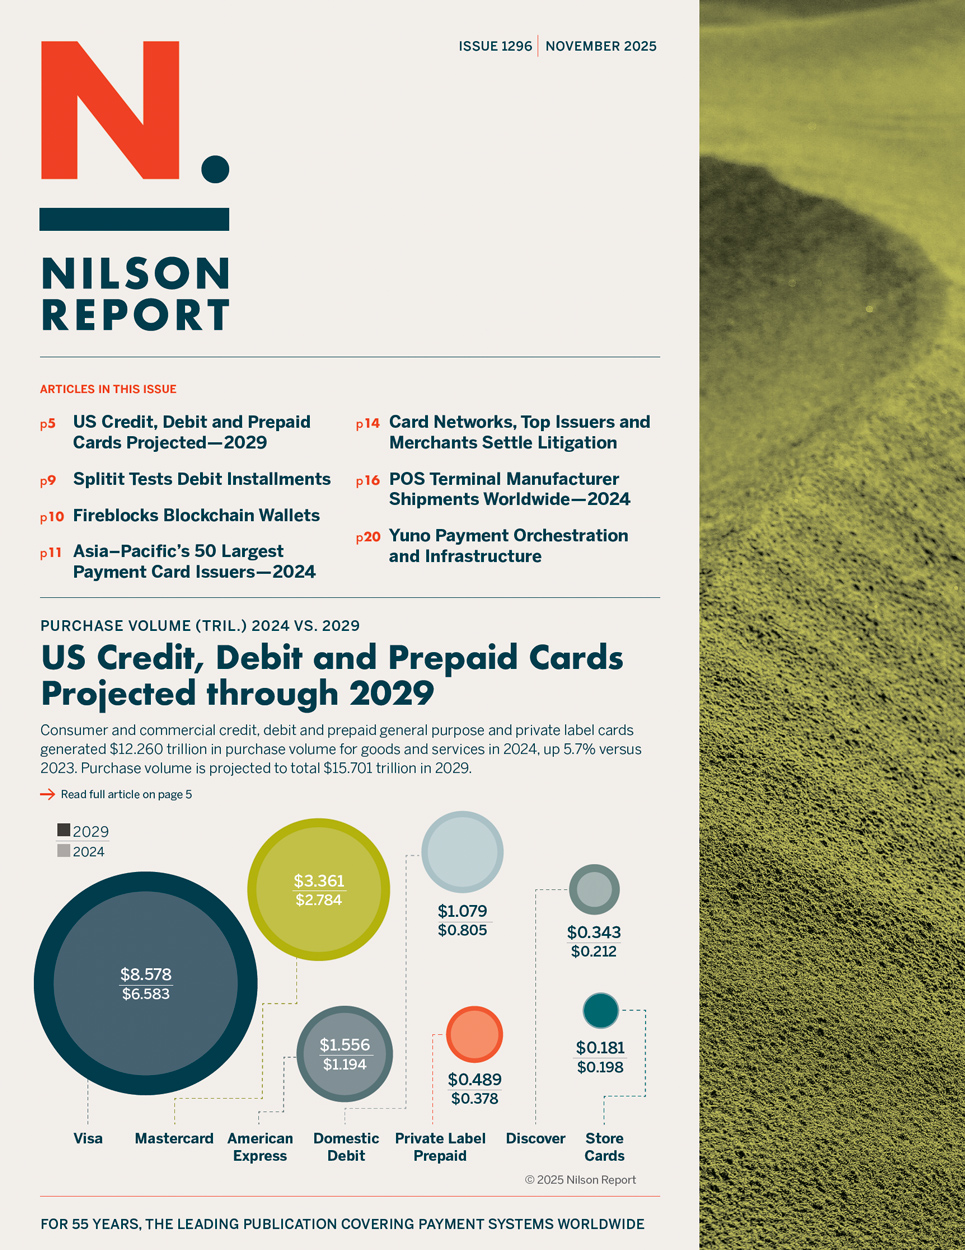
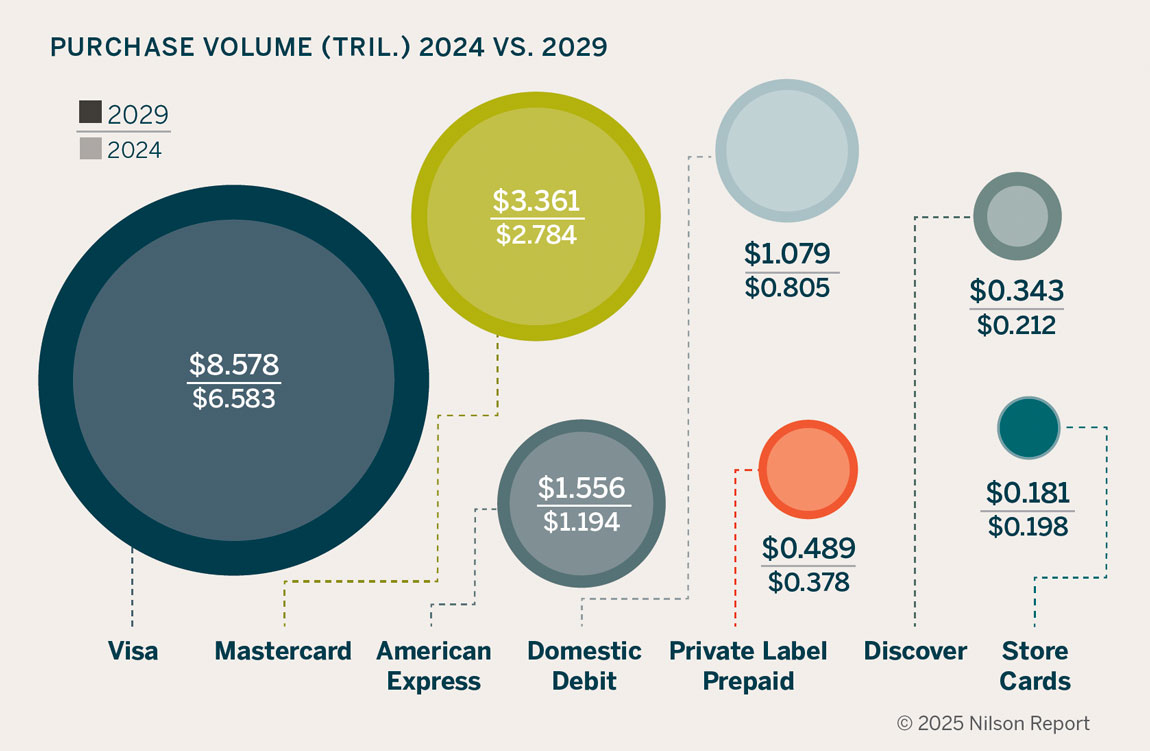
US Credit, Debit and Prepaid Cards Projected through 2029
US Credit/Debit Purchase Volume Projected in Trillions with Percentage Change—2019 vs 2029
US Outstandings Projected in Billions with Percentage Change 2019 vs 2029
US Cards Projected — 2029
US Purchase Transactions Projected — 2029
US Purchase Volume Projected — 2029
US Total Transactions Projected — 2029
US Total Volume Projected — 2029
Market Shares of Purchase Volume for Asia Pacific Card Issuers in 2024
Top General Purpose Card Issuers in Asia–Pacific — 2024
Top Credit Card Issuers in Asia–Pacific — 2024
Top Debit Card Issuers in Asia–Pacific — 2024
POS Terminals Shipped — 2024
POS Manufacturers’ Market Shares and Shipments — 2024
Manufacturers of POS Terminals — 2024 Shipments by Region
Investments & Acquisitions in the Payment Card Industry — October 2025
POS Terminal Manufacturer Shipments Worldwide
The 50 largest manufacturers of POS terminals worldwide are ranked on page 17. Collectively, they shipped 128.1 million devices in 2024. The five largest manufacturers are listed here.
Newland …. 9.33 million devices
Landi…………8.53 million devices
Pax Tech. ….8.48 million devices
Centerm…….7.86 million devices
Tianyu……….7.57 million devices
Full access to POS Terminal Manufacturer Shipments Worldwide — 2024 is available when you subscribe or log in to the Nilson Report.
Our Free Trial Offer Just Got an Upgrade
Start Two Months of Full Access to the Nilson Report
Free trial access now includes all subscriber benefits, including complete data tables on issuers and acquirers worldwide and our exclusive subscriber portal.
No Restrictions. No payment card required.
See why executives in 80+ countries rely on the Nilson Report for best-in-class data and business intelligence.