Award-winning business intelligence, payment card statistics, industry news, and dozens of executive contacts in every issue. Subscribers receive 22 issues a year.
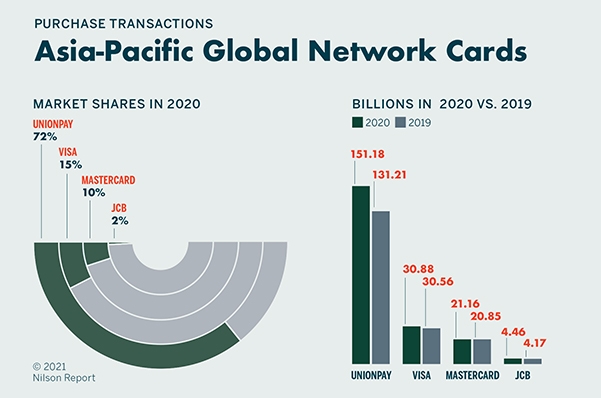
The six brands of global cards issued in the Asia-Pacific region, UnionPay, Visa, Mastercard, JCB, American Express and Diners Club generated 208.75 billion transactions in 2020, an increase of 11.0% over 2019.
Featured Companies
The following companies are featured in this issue of the Nilson Report. News about companies appears in feature articles, as well as in the First Look and Management Changes sections of the newsletter. To submit general information about your company, or to share news with us, please contact us.
The steady growth of business-to-business payments is driving corporate
investments and acquisitions in that sector. For your convenience, we’ve
assembled the B2B payment investments that took place in the first half
of the year and ranked them on page 13.
Asia-Pacific Global Network Cards 2020—Purchase Transactions
Asia-Pacific Spending, Transaction and Cards by Global Brand
Asia-Pacific Market Shares of Purchase Transactions—2008-2020
U.S. Debit Card Issuers—Ranked 51-100
U.S. Merchant Processing Fees—2020
Mergers & Acquisitions and Corporate Financing Transactions—January-June 2021
FEATURED STATISTICS
U.S. Merchant Processing Fees—2020
Merchants in the United States paid $110.32 billion in processing fees in 2020 to accept $7.630 trillion in credit and debit card purchase volume. Fees paid declined 5.2% from 2019.
Full access to the United States Merchant Processing Fees–2020 is available when you subscribe to the Nilson Report.
Our Free Trial Offer Just Got an Upgrade Start Two Months of Full Access to the Nilson Report
Free trial access now includes all subscriber benefits, including complete data tables on issuers and acquirers worldwide and our exclusive subscriber portal. No Restrictions. No payment card required.
See why executives in 80+ countries rely on the Nilson Report for best-in-class data and business intelligence.