Article

Mentioned Companies:

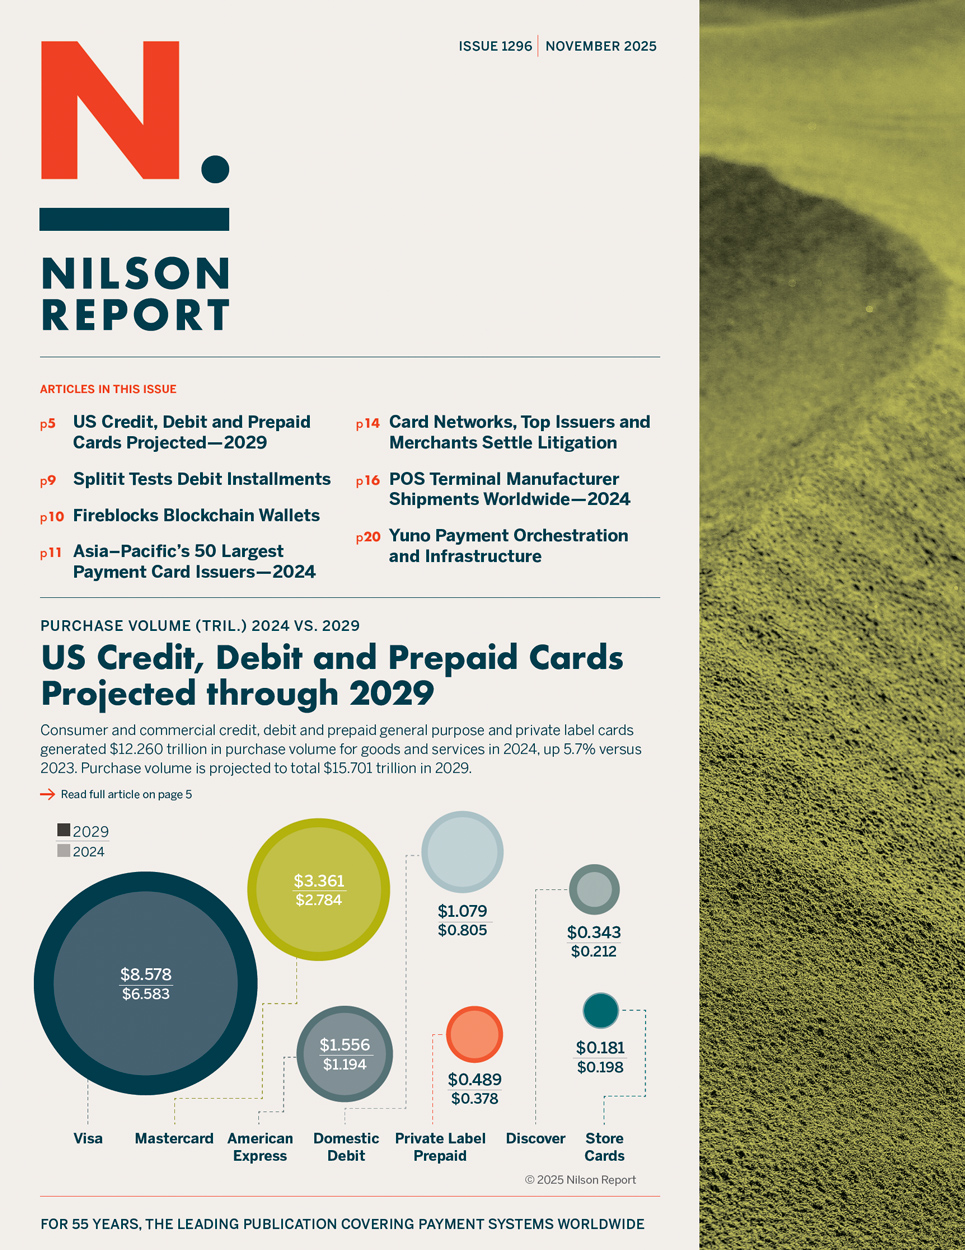
US Credit, Debit and Prepaid Cards Projected — 2029

Purchase volume generated by general purpose and private label credit, debit and prepaid cards issued in the US— consumer and commercial products combined—was $12.260 trillion in 2024, up 5.7% from 2023. Credit card purchase volume was $6.425 trillion, up 5.0% from 2023. Debit and prepaid card purchase volume was $5.835 trillion, up 6.6% from 2023. For the complete ranking, log in and download Issue 1296. Credit cards accounted for 52.41% of credit and debit card purchase volume combined, down from 52.78% in 2023. Credit and debit...

Want to read more?

Please log into your subscriber account.
OR

Check out our subscription offers.
New subscribers receive over 130 articles in the 22 issues published each year, plus the last five years of issues (that’s over 1,200 articles) as a download link, which are fully searchable in PDF format.

© Copyright 2025 Nilson Report

Newsletter

November 2025

Articles in this Issue

Charts, Tables and Graphs in this Issue

Available only to subscribers

US Credit, Debit and Prepaid Cards Projected through 2029

US Credit/Debit Purchase Volume Projected in Trillions with Percentage Change—2019 vs 2029

US Outstandings Projected in Billions with Percentage Change 2019 vs 2029

US Cards Projected — 2029

US Purchase Transactions Projected — 2029

US Purchase Volume Projected — 2029

US Total Transactions Projected — 2029

US Total Volume Projected — 2029

Market Shares of Purchase Volume for Asia Pacific Card Issuers in 2024

Top General Purpose Card Issuers in Asia–Pacific — 2024

Top Credit Card Issuers in Asia–Pacific — 2024

Top Debit Card Issuers in Asia–Pacific — 2024

POS Terminals Shipped — 2024

POS Manufacturers’ Market Shares and Shipments — 2024

Manufacturers of POS Terminals — 2024 Shipments by Region

Investments & Acquisitions in the Payment Card Industry — October 2025