Award-winning business intelligence, payment card statistics, industry news, and dozens of executive contacts in every issue. Subscribers receive 22 issues a year.
U.S. personal consumption expenditures reached $13.321 trillion in 2017. Purchases of goods and services accounted for 77.64% or $10.343 trillion of that amount.
Featured Companies
The following companies are featured in this issue of the Nilson Report. News about companies appears in feature articles, as well as in the First Look and Management Changes sections of the newsletter. To submit general information about your company, or to share news with us, please contact us.
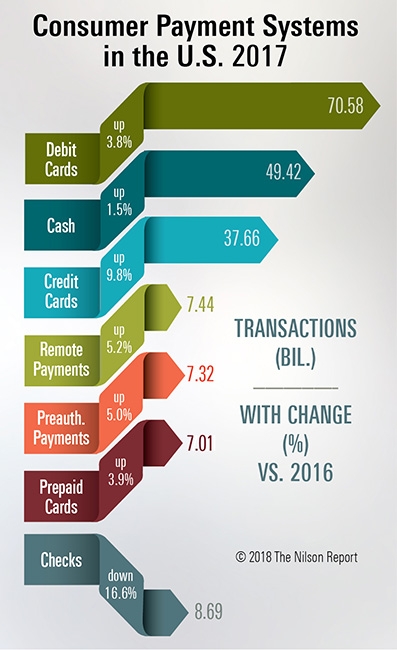
U.S. Consumer Payment Systems—Paper, Cards, Electronic
Personal Consumption Expenditures in the U.S.
Top Credit Card Issuers by Purchase Volume & Country 2017
Mastercard & Visa Worldwide through 3rd Quarter 2018
FEATURED STATISTICS
Mastercard & Visa Worldwide through 3rd Quarter 2018
Global purchase volume in the Visa and Mastercard networks reached $9.377 trillion for the first nine months of 2018. The U.S. total was $3.843 trillion.
Full access to the Mastercard & Visa Worldwide through 3rd Quarter 2018 results is available when you subscribe to The Nilson Report.
Our Free Trial Offer Just Got an Upgrade Start Two Months of Full Access to the Nilson Report
Free trial access now includes all subscriber benefits, including complete data tables on issuers and acquirers worldwide and our exclusive subscriber portal. No Restrictions. No payment card required.
See why executives in 80+ countries rely on the Nilson Report for best-in-class data and business intelligence.