Award-winning business intelligence, payment card statistics, industry news, and dozens of executive contacts in every issue. Subscribers receive 22 issues a year.
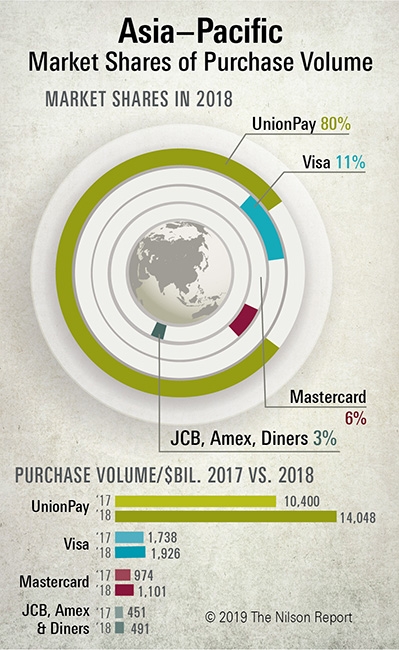
UnionPay, Visa, Mastercard, JCB, American Express, and Diners Club credit, debit, and prepaid cards issued in the Asia-Pacific region generated $17.566 trillion in purchases of goods and services in 2018, up 29.5% over 2017.
Featured Companies
The following companies are featured in this issue of the Nilson Report. News about companies appears in feature articles, as well as in the First Look and Management Changes sections of the newsletter. To submit general information about your company, or to share news with us, please contact us.
Largest U.S. Issuers of Consumer Visa and Mastercard Cards 2018
Asia–Pacific Market Shares of Purchase Transactions by Brand 2018
Asia–Pacific General Purpose Cards 2018 vs. 2017
Year-Over-Year Growth/Decline in Purchase Volume on Cards Issued in Asia–Pacific
Prepaid Cards in the U.S. 2018
U.S. Visa & Mastercard Commercial Cards–Purchase Volume 2018
FEATURED STATISTICS
U.S. Visa & Mastercard Commercial Cards–Purchase Volume 2018
Visa and Mastercard commercial card purchase volume reached $982.69 billion last year, up 12.4%. Credit cards accounted for $718.73 billion of that total.
Small business cards had the greatest growth among commercial cards in the U.S. when ranked by purchase volume in 2018. Full access to these results is available when you subscribe to The Nilson Report.
Free Sample Issue
Act Now – Receive a free issue of the Nilson Report